
Cell cycle can be analysed flow cytometrically by the use of fluorescent DNA dyes (typically propidium iodide, DAPI and Hoechst 33342) that bind to DNA in a stoichmetric manner making the fluorescent signal directly proportional to the amount of DNA. Ploidy of cells can also be detected as well as senescent cells by the use of RNA binding dye, Pyronin Y and DNA binding dye Hoechst 33342, see figure.
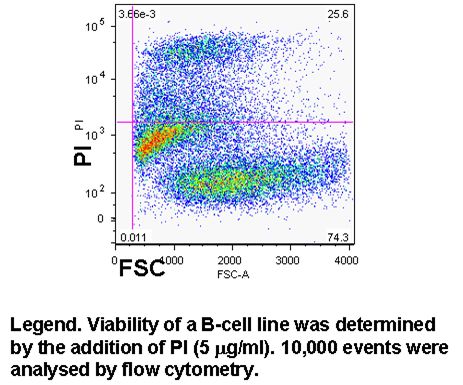
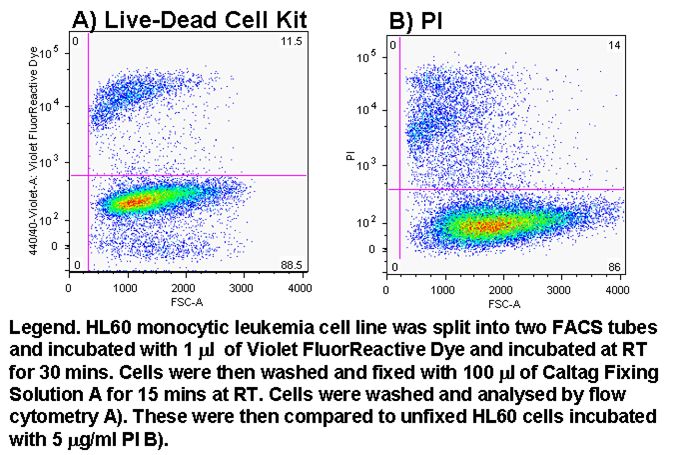
Cell viability can easily be determined in flow cytometry by adding one of DNA binding dyes at relatively low concentration to a population of cells. A common appproach is to use propidium iodide (PI) and 5 mg/ml; but there is a wide selection of dyes that can be used, which include 7-AAD, DAPI, DRAQ7 (Biostatus), SYTOX ADDVanced and To-Pro-3 all of these have to be used with caution as live cells will eventually take up these dyes if left to long, see figure and protocols.
Protein translocation
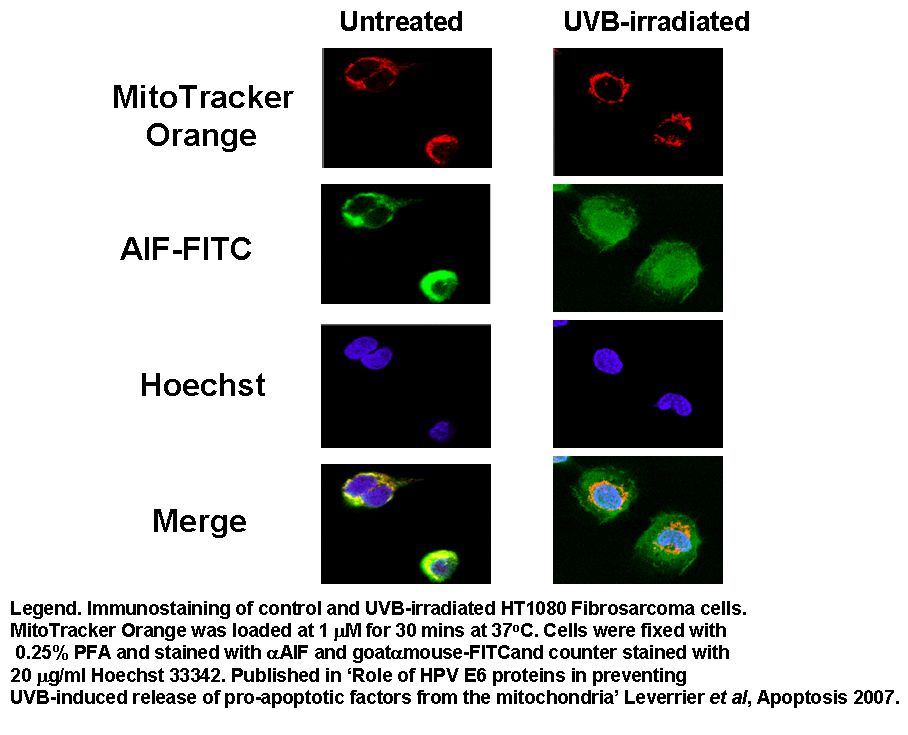
The translocation of proteins involved in apoptosis can be semi-quantitated by flow cytometry. Fluorescently labelling the organelles and the protein under investigation allows the protein to be measured by flow cytometry after lysing the cell population.
Apoptosis Inducing Factor (AIF) translocates from the mitochondria to the nucleus in cells undergoing apoptosis where AIF fragments DNA. This translocation can be measured by fluorescently labelling mitochondria with Mitotracker Orange, this probe is not released upon cell death or fixing of the cells. Cells were then UVB-irradiated and incubated for 24 h.
Cells were then fixed and permeabilised and labelled with anti-AIF-FITC and Hoechst 33342. Whole cells are analysed and confocal laser scanning micrographs taken to show the intracellular location of the fluorescent probes. After homogenisation, cells were re-analysed on a BD LSRI with 1 million events collected.
FRET
Cell cultures of cells transfected for two proteins labelled with CFP and YFP often have low levels of expression and only a small population of cells will be capable of FRET given the level of expression of the two proteins of interest, see figure.
The sorting of such live cells demonstrating FRET can be done to improve the level of FRET detectable in cultures before imaging of FRET by microscopy. An Aria I cell sorter instrument fitted with a violet diode and argon laser, firstly excites the YFP with 488 nm laser which emits in the argon laser 530 nm PMT. Next, violet diode excitation (405nm) of the Donor, CYP transfers energy non-radiatively to the Acceptor, YFP which then emits FRET derived energy at 530 nm in the violet diode 530nm PMT, see figure for pictorial explanation in Theory of FRET detection.
The high double positive culture of cells was then imaged on a Zeiss 510 confocal microscope. CFP and YFP was excited by the 405 and 514nm laser lines. Images of FRET were produced by the Sensitization method and FRET images calculated via the Zeiss FRET software, see figure.
Calcium
Cell Death
Cell counts per volume and cell viability can be determined on the mini flow cytometer the Millipore Muse. Cells to be counted are mixed with the cell viablity dyes supplied in the Cell Count and Viability Kit (Cat No MCH100103). Small debris is then gated out via a cell size parameter. Dead cells are double positive whilst live cells are single positve as shown on the cell nucleated paramerter. Dilution factors can be inputted into the software to show the cell concentration in the original sample, see figure.
Early and late stages of cell death
A cell becomes necrotic when the plasma membrane integrity is compromised sufficiently to let viability dyes such as propidium iodide, DAPI or DRAQ7 into the cell. Late apoptosis or necrosis can be identified by SubG1 DNA analysis. Early necrosis can now be identified by the use of plasma membrane probe, Bis-oxonol. Dead or necrotic cells display a differential signal of Bis-oxonol. DNA analysis of high and low intensity Bis-oxonol events show that low intensity events have a greater level of DNA in the SubG1 area compared to the high intensity events, see figure. The side scatter of high and low intensity bis-oxonol events are also larger when the intensity of bis-oxonol is high and vice a versa. Thus dead cells can now be identified as early or late necrosis by a combination of a viability dye, Bis-oxonol,The side scatter of high and low intensity bis-oxonol events are also larger when the intensity of bis-oxonol is high and vice a versa. Thus dead cells can now be identified as early or late necrosis by a combination of a viability dye, Bis-oxonol, quantification of DNA and side scatter, see figure.